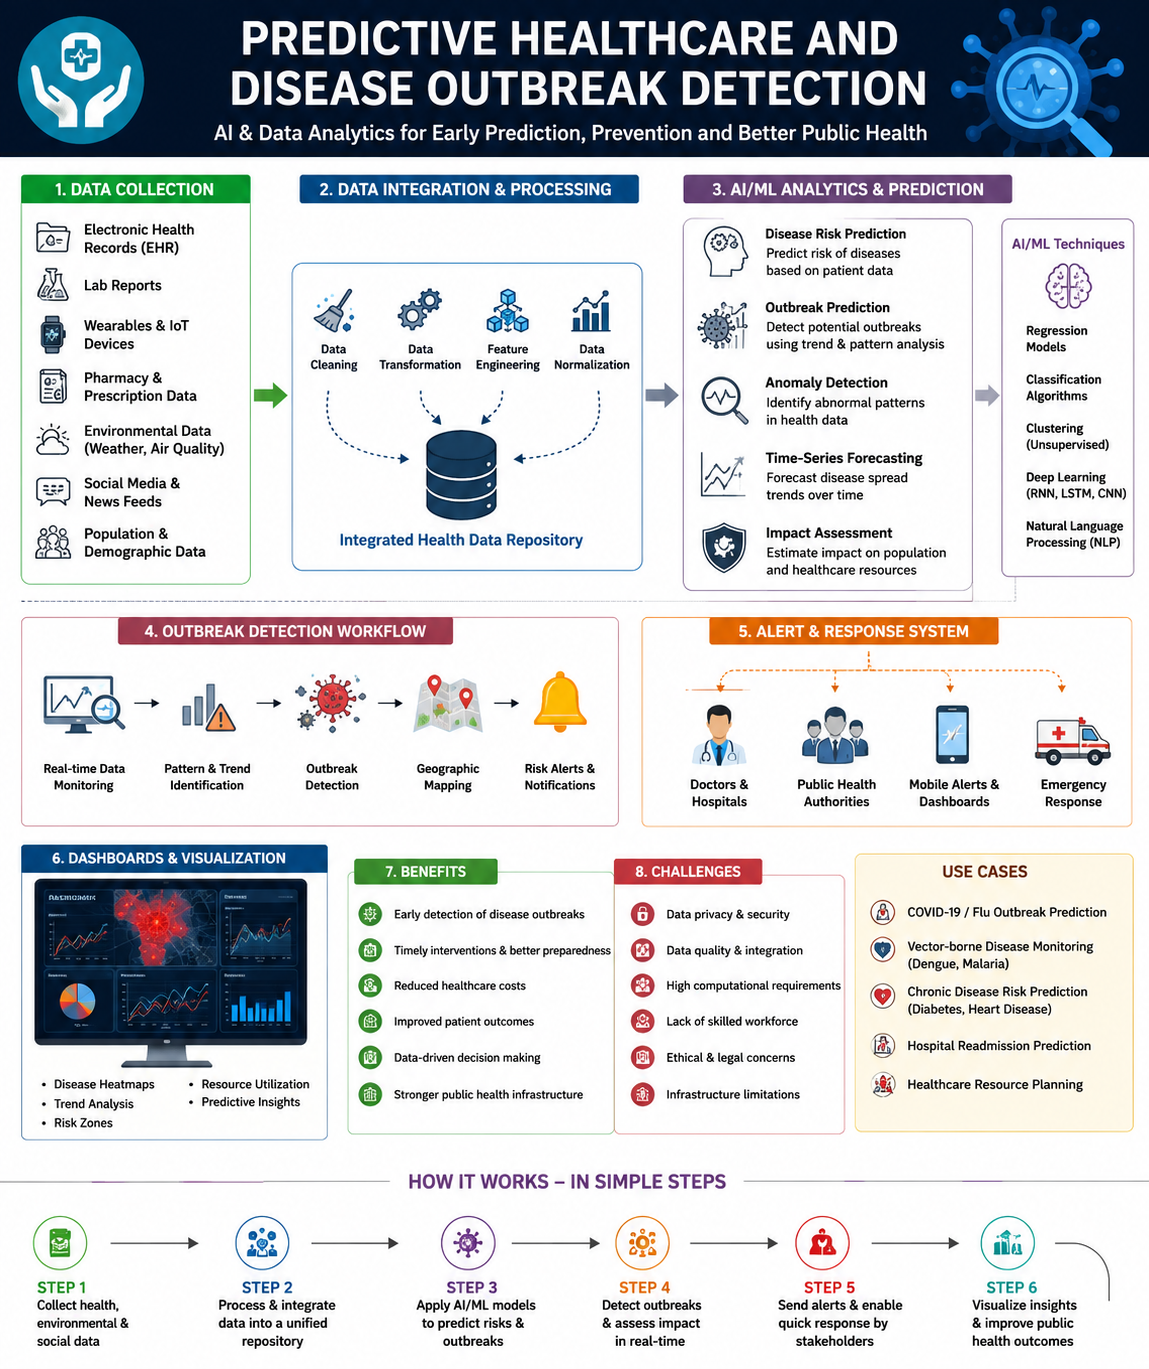
Integration of IoT & Predictive Healthcare
Convergence of Real-Time Monitoring and Predictive Intelligence for Next-Gen Healthcare
1. The Convergence: IoT + Predictive Analytics
Why Integration Matters
IoT Health Monitoring generates massive real-time data streams — heart rates, glucose levels, activity patterns, sleep quality, and environmental conditions. Predictive Healthcare provides the intelligence layer that transforms this raw data into actionable foresight. Together, they create a closed-loop system where continuous monitoring feeds predictive models, and predictions trigger automated interventions.
This convergence represents the foundation of Precision Health 4.0 — a paradigm where healthcare is predictive, preventive, personalized, and participatory (the "4Ps").
IoT Layer
Continuous data collection from wearables, implants, ambient sensors, and medical devices
AI/ML Layer
Real-time analytics, anomaly detection, risk scoring, and predictive modeling
Action Layer
Automated alerts, personalized interventions, clinical decision support, and care coordination
2. Integrated System Architecture
Edge-to-Cloud Pipeline
- Edge Processing: IoT devices run lightweight ML models (TensorFlow Lite) for instant anomaly detection and filtering of normal data
- Fog Computing: Local gateways aggregate data, perform intermediate analytics, and manage device connectivity
- Cloud Analytics: Deep learning models, population-level analytics, and long-term trend analysis
- Feedback Loop: Model updates pushed back to edge devices for continuous improvement
Data Fusion Framework
- Multi-modal Fusion: Combining physiological (vitals), behavioral (activity), and environmental (air quality) data
- Temporal Fusion: Aligning data streams with different sampling frequencies (ECG: 250Hz, temperature: 1Hz)
- Contextual Enrichment: Adding EHR data, medication schedules, and social determinants
- Uncertainty Quantification: Bayesian approaches to handle sensor noise and missing data
Example: Integrated Sepsis Detection
IoT Input: Continuous SpO2, heart rate variability, skin temperature from wearable patch
Predictive Model: LSTM network trained on 50,000+ sepsis cases, updated weekly with new data
Real-time Output: Risk score updated every 5 minutes; alert triggered at score > 0.7
Automated Action: EHR order set for lactate + blood culture; page on-call physician; notify rapid response team
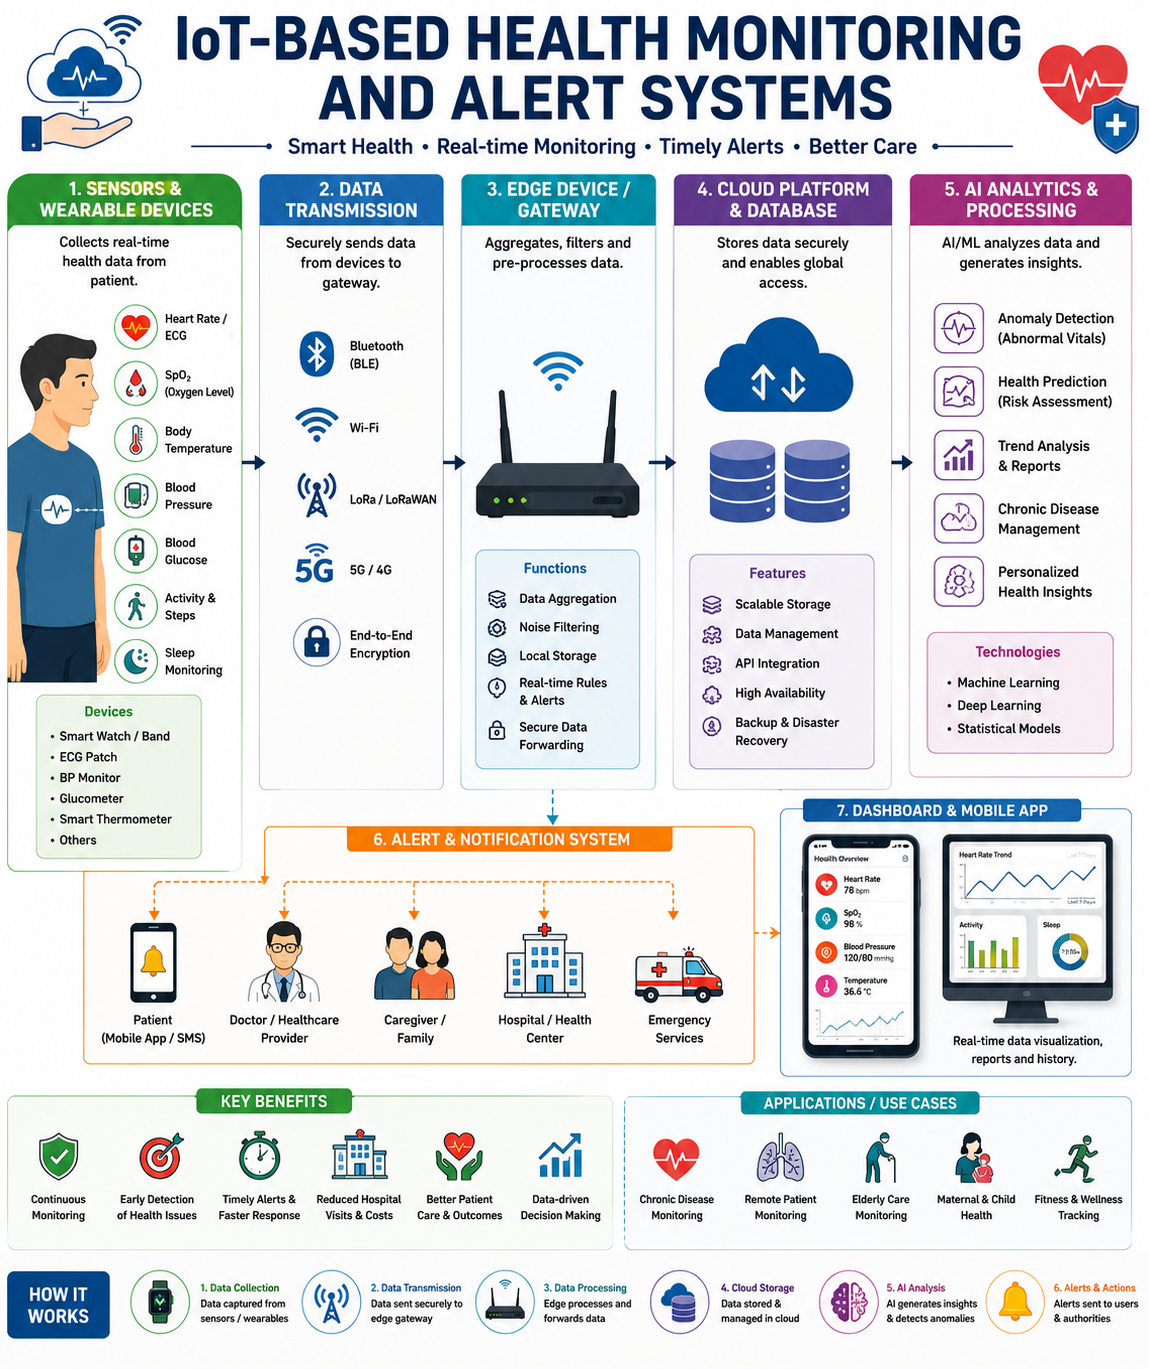
3. Integrated Use Cases
| Use Case | IoT Components | Predictive Analytics | Outcome |
|---|---|---|---|
| Hospital-at-Home | Wearable vitals, pulse ox, BP cuff, tablet app | Readmission risk model, deterioration index | 30% cost reduction, 95% patient satisfaction |
| Chronic Disease Mgmt | CGM, smart inhaler, activity tracker | Exacerbation prediction, medication optimization | 40% fewer ER visits, improved HbA1c |
| Post-Surgical Monitoring | Wireless cardiac patch, temperature sensor | Infection prediction, arrhythmia detection | 50% reduction in complications |
| Elderly Fall Prevention | Smartwatch, ambient motion sensors, smart home | Gait analysis, fall risk scoring | 60% reduction in fall-related injuries |
| Mental Health Monitoring | Phone sensors, sleep tracker, voice analysis | Depression relapse prediction, crisis detection | Earlier intervention, reduced hospitalization |
| Infectious Disease Surveillance | Population wearables, environmental sensors | Outbreak detection, Rt estimation | 7-14 day earlier detection |
4. Comparative Analysis
| Dimension | IoT Health Monitoring | Predictive Healthcare | Integrated Approach |
|---|---|---|---|
| Primary Focus | Real-time data collection & transmission | Pattern recognition & forecasting | Closed-loop intelligent care |
| Data Type | Streaming sensor data (high frequency) | Historical structured data (batch) | Hybrid: real-time + historical fusion |
| Response Time | Milliseconds to seconds | Hours to days | Adaptive: instant alerts + strategic foresight |
| Key Technology | Embedded systems, wireless protocols | Machine learning, statistical modeling | Edge AI, digital twins, federated learning |
| Stakeholder | Patients, caregivers, clinicians | Public health, researchers, administrators | All stakeholders with role-based insights |
| Limitation | Alert fatigue, false positives | Data latency, model drift | Complexity, interoperability challenges |
| ROI Driver | Reduced hospital stays, remote care | Prevention, resource optimization | Holistic cost reduction + quality improvement |
5. Unified Technology Stack
Device & Edge
- ARM Cortex-M4/M7 microcontrollers
- TensorFlow Lite / ONNX Runtime
- FreeRTOS / Zephyr OS
- Bluetooth 5.3, Thread, Matter
- Edge TPU / Coral AI accelerators
Connectivity & Middleware
- Apache Kafka / AWS Kinesis
- MQTT brokers (HiveMQ, EMQX)
- API Gateways (Kong, Apigee)
- HL7 FHIR for interoperability
- OAuth 2.0 + OpenID Connect
Cloud & Analytics
- AWS IoT Core / Azure IoT Hub
- Apache Spark / Databricks
- Kubernetes / Docker containers
- PostgreSQL + TimescaleDB
- MLflow / Kubeflow pipelines
AI/ML Frameworks
- PyTorch / TensorFlow
- Scikit-learn / XGBoost
- Hugging Face Transformers
- Apache MXNet for edge
- NVIDIA Clara for healthcare
Visualization & UI
- React / Angular / Vue.js
- D3.js / Chart.js / Plotly
- Grafana for monitoring
- Power BI / Tableau
- Flutter for cross-platform apps
Security & Compliance
- HashiCorp Vault for secrets
- HIPAA-compliant cloud (HITRUST)
- Blockchain for audit trails
- Zero Trust Architecture
- SIEM (Splunk, Elastic)
6. Evolution Roadmap
Foundation Phase
Basic RPM, cloud storage, rule-based alerts, EHR integration pilots
Integration Phase
Edge AI, predictive alerts, digital twins, federated learning adoption
Autonomous Phase
Closed-loop therapeutics, population digital twins, quantum-enhanced analytics
Ubiquitous Phase
Invisible monitoring, AI physicians, global health resilience networks
7. Integration Challenges & Mitigation
Interoperability
Problem: Devices use proprietary protocols; EHR systems don't communicate seamlessly.
Solutions:
- Adoption of HL7 FHIR R4/R5 standards
- Fast Healthcare Interoperability Resources APIs
- Common data models (OMOP CDM, i2b2)
- Open-source integration engines (Mirth Connect)
Data Quality & Bias
Problem: Sensor noise, missing data, demographic bias in training datasets.
Solutions:
- Sensor calibration frameworks
- Imputation algorithms (MICE, deep learning)
- Fairness constraints in model training
- Diverse, representative training cohorts
Scalability
Problem: Millions of devices generating petabytes of data daily.
Solutions:
- Serverless architectures (AWS Lambda)
- Data lakehouses (Delta Lake, Iceberg)
- Intelligent data tiering (hot/warm/cold)
- Model compression and quantization
Regulatory Complexity
Problem: Software as Medical Device (SaMD) regulations vary globally.
Solutions:
- FDA Pre-Cert Program for AI/ML
- EU MDR compliance frameworks
- Continuous validation pipelines
- Post-market surveillance automation
8. Future Vision: 2030 and Beyond
Digital Health Twins
Every individual will have a living digital replica updated in real-time by IoT sensors. These twins will simulate treatment responses, predict disease trajectories decades in advance, and enable "what-if" scenario testing for lifestyle changes.
Ambient Intelligence
Homes, cars, and workplaces will contain invisible sensor networks that monitor health passively. No wearables needed — walls, furniture, and mirrors will track vitals through radar, computer vision, and acoustic analysis.
Global Health Immune System
A worldwide network of IoT sensors, genomic sequencers, and AI models functioning as a collective immune system. Pandemics detected and contained within days, not months, through automated global response coordination.
Neuro-Digital Interfaces
Brain-computer interfaces (BCIs) will merge with predictive health systems, enabling direct neural monitoring for mental health conditions, epilepsy prediction, and cognitive decline early warning.
Autonomous Care Ecosystems
AI-driven care coordination where IoT detects a problem, predictive models determine optimal intervention, robots deliver medication, and telehealth provides follow-up — all without human intervention for routine cases.
Personalized Preventive Genomics
Whole-genome sequencing at birth combined with lifelong IoT monitoring and AI prediction will create hyper-personalized prevention plans, reducing chronic disease burden by 70%.
9. Key Takeaways
Summary Points
- IoT Health Monitoring provides the sensory nervous system of modern healthcare — continuous, real-time, and patient-centered data collection
- Predictive Healthcare serves as the brain — analyzing patterns, forecasting outcomes, and enabling proactive interventions
- Integration creates a closed-loop system where data flows seamlessly from sensors to insights to actions
- Challenges remain in interoperability, bias, privacy, and regulatory frameworks — but standards and technologies are rapidly maturing
- The future points toward invisible monitoring, digital twins, autonomous care, and a global health immune system
- Success requires collaboration between technologists, clinicians, policymakers, and patients